These 10 updates from Google Data Studio go head-to-head with expensive software, but GDS is both free and offers better integration with Google Adwords, 360, and Analytics. In the last year alone, countless updates and features have been released to enhance your data visualization capabilities.
Some of our favorites include:
1. Conditional Formatting with & and OR
You can now create formatting rules to add color and style to your data based on conditions you define. This gives you the ability to highlight important data sets or KPIs within a chart.2. Improved Data ModelingGoogle has improved how fields are defined and aggregated by default in your data sources. These changes make it easier to model your blended data, and make calculated fields more robust. No more manually defined date ranges!3. Simplified Cache
One single data cache eliminates the need to separately manage caches for different data source types. This is a time saver and keeps all your data in sync. 4. Viewer Selected Fields
Make your charts and tables show more by adding optional metrics, giving viewers the ability to select which fields to display in the chart. This will give you a big advantage in showing data points that are related, such as clicks and click-through rate.5. Automatically Update Extracted Data Sources
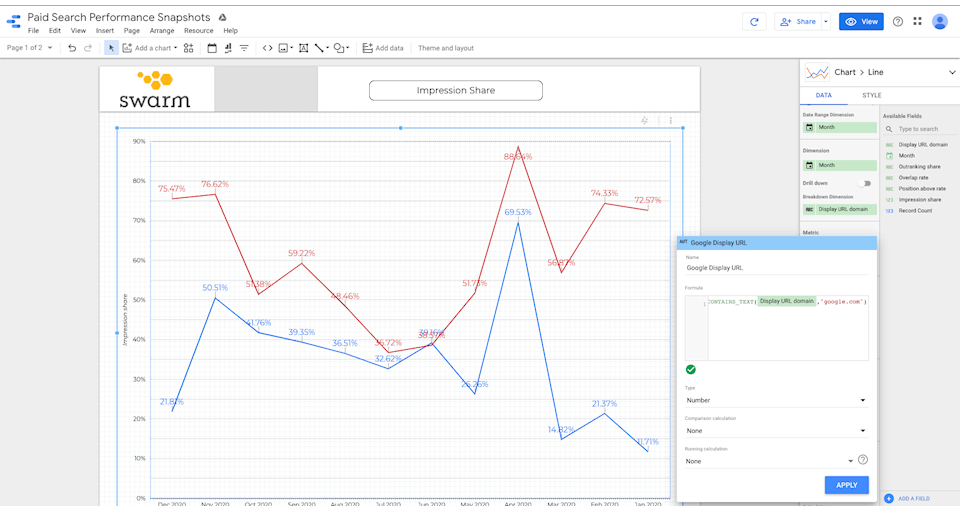
Automatically refresh data in an Extract Data data source by enabling “Auto update” and setting a refresh schedule. Setting a refresh schedule really improves report performance and accuracy. Also, who doesn’t like automating a manual and mundane task?6. New Text Functions
Have you ever wanted to create a function within a data source based on specific text from a data point? Use these functions in calculated fields in reports and data sources:CONTAINS_TEXT — Returns true if the specified text is found in the field or expression, otherwise returns false.
STARTS_WITH — Returns true if the field or expression begins with the specified text, otherwise returns false.
ENDS_WITH — Returns true if the field or expression ends with the specified text, otherwise returns false.
LEFT_TEXT — Returns a number of characters from the beginning of a specified string.
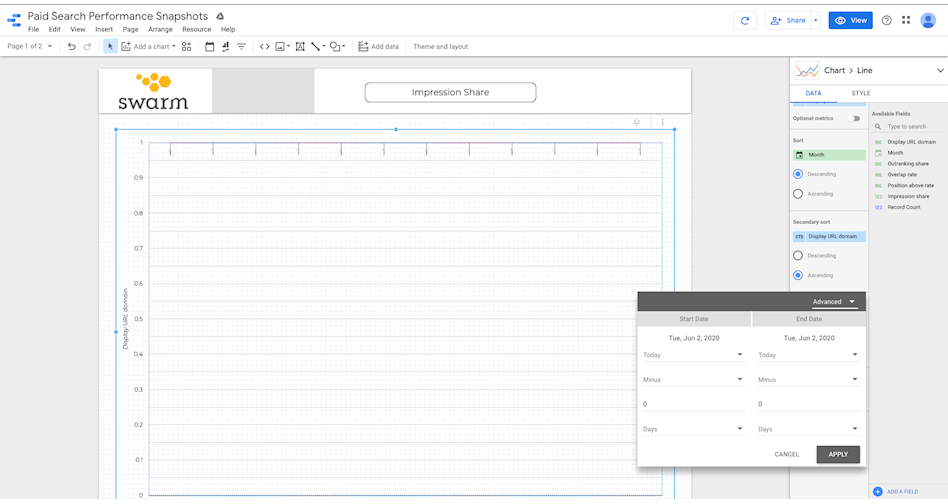
RIGHT_TEXT — Returns a number of characters from the end of a specified string.This gives you the ability to standardize things like campaign name via calculated fields for blended data sources.7. More Dimensions in Tables (From Google Sheets)Tables using the Google Sheets connector can now have up to 20 dimensions. This gives you the ability to break down and blend data elements like the date or time. 8. Advanced Date Comparison
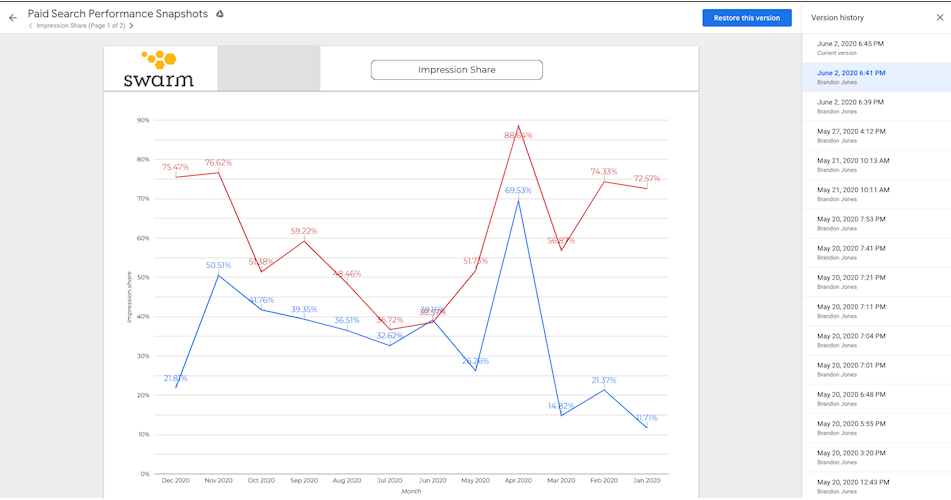
Custom date comparison lets you compare the currently selected period to another custom period. By default, the comparison period is fixed, meaning the chart always compares to the exact dates you specify. Google gives you the ability to change this so the comparison range is a rolling date window that advances over time. Now you can show that comparison of every third Monday, or whichever cadence is important to your stakeholders.9. Version History
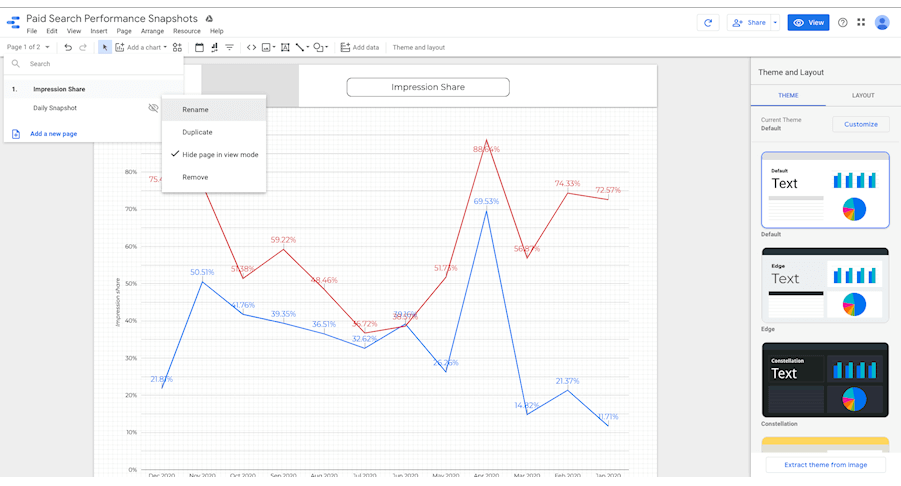
Have you ever accidentally given someone edit access to a report? You can now see what’s changed in Data Studio. Version history will allow you to view and restore previous versions (similar to Google Drive documents/sheets) of a report or data source.10. Hide Page
We have all run into the dilemma of a page being under construction or containing information you only want other editors to see. Now Google gives you the ability to hide pages in view mode.Depending on how you use Google Data Studio, some of these updates may be total game changers. If you want to check out the rest of the Google Data Studio updates from 2019 to now, check them out here.
SCS UNITES WITH SWARM – A DIGITAL PERFORMANCE AGENCY, TO ADD MORE FOCUS ON RESULTS
Together as SCS, the new union will include 100 people across three offices – Atlanta, Southern California, and Ottawa (Canada) – and offer an integrated digital, media, creative and marketing consultancy designed as a modern, agile-solution at scale for national and international brand management.